Data, Discovery & Decision

I'm building the next set of AI bots that will change the world, and maybe replace you🙃
Hi there!
I have not sat down to pen my thoughts in quite some time, but with the amount of research and learning I have been doing in the past few weeks, I thought it best to share some of it here.
In this article, I will be sharing my experience so far working with data. I will also be sharing some insights that I have discovered, as well as the decisions that can be made from those discoveries. For the sake of those that enjoy illustrations, I will be using a pseudo-analysis for John Smith (A new movie production manager) to drive home some very vital points.
Let's go!
Right now, we know that data is most likely on the list of top ten 'tech terminologies', and if you are reading this you definitely have an idea of what it means. However, the major challenge we face today is the overwhelming amount of data at our disposal.
When you visit your favorite website, you will most likely be required to sign up and your data will be captured from that point onward. It is evident that data is almost the most supreme tool of technology on earth. However, from a real data scientist's point of view, data is the second most important thing in data science after the question you are trying to answer or the problem you are trying to solve.
Data alone cannot solve anything. You must have a problem statement that you will use to attack the challenge at hand intelligently
That being said, I will dive into our pseudo-analysis for the day. Remember it all starts with the question(s) or the challenge at hand. I came up with a problem that we can quickly work with;
Statement: John Smith, a new production manager for Star Media Inc is about to release his first movie, and he has requested my help in determining how to make his first movie successful.
I will be using the popular movies dataset, and I have constrained my walkthrough to five steps;
The Questions
This step is vital because if you cannot clearly define the problems by asking questions, you cannot move forward.
Some Questions: a.)What genre of movies have had a higher "success rate" over the years? b.) How much money is one likely to spend to make a great movie? c.)What actors or directors bring the most value to movies? d.) Is there a 'best time' to release a movie? The questions were gotten from the concerns about his debut into the industry. Luckily, we have data- who always has our back😉.
2. The Understanding
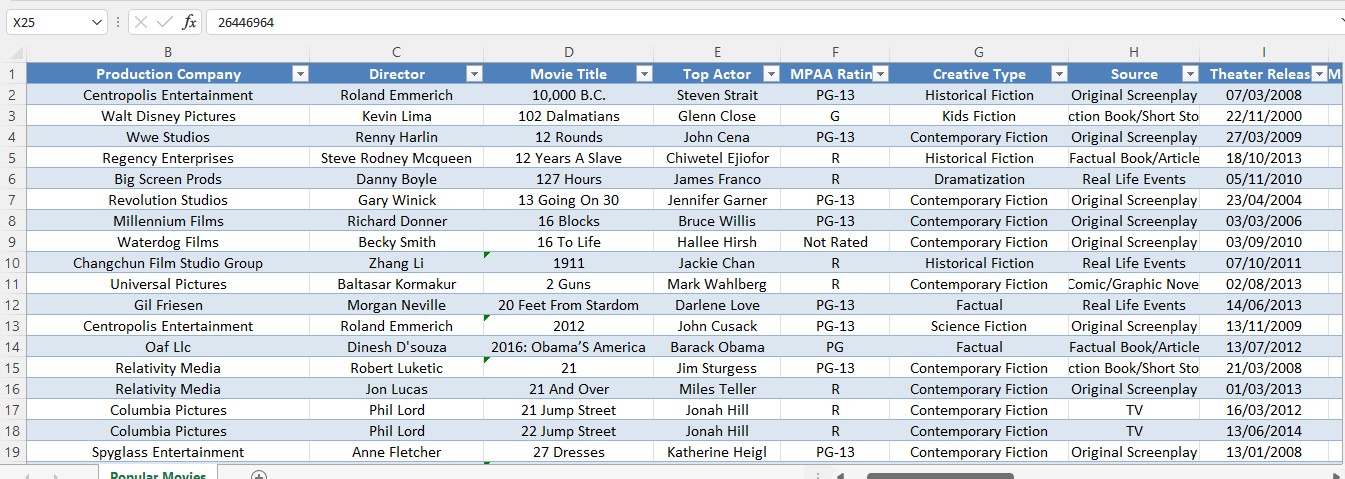
Once you can clearly define the questions, the next step is to understand the data at hand! What type of data are you working with? How many columns does the dataset contain? What is your source? Is it yearly, quarterly, or monthly data? Is your data structured or unstructured? Does it require some domain expertise? In this case, the popular movies dataset is structured, and the data is annual from 1939 to 2015. It can also be gotten directly from Kaggle.
3. The Cleaning
In some software tools, this process is referred to as transformation. It is the process of editing, correcting, and structuring data within a dataset so that it’s generally uniform. Data cleaning is often a tedious process, but it’s absolutely essential to get top results and powerful insights from your data. Some of the popular things you might want to do are not limited to but include; Removing irrelevant data, deduplicating the data, fixing structural errors, dealing with missing data, filtering out data outliers, etc
4. The Visualization
After you have fully understood your data, it is now time to choose from a wide variety of data visualization tools. (E.g Microsoft Power BI, Tableaux, Google Charts, etc). The key concept of data visualization is to convey a message in the simplest form possible to aid easy and effective understanding. Charts are there to interpret and break down variables, choosing the right one will determine the professionalism while presenting your data. Some best practices include; pre-attentive attributes, data-ink ratio, avoidance of chart junk, and many more.
5. The Decision
After analyzing the data, it is essential to interpret the results. Simply put, what are you learning from the results, and what are you going to do about it? From the movie dataset, the following were the insights that I generated;
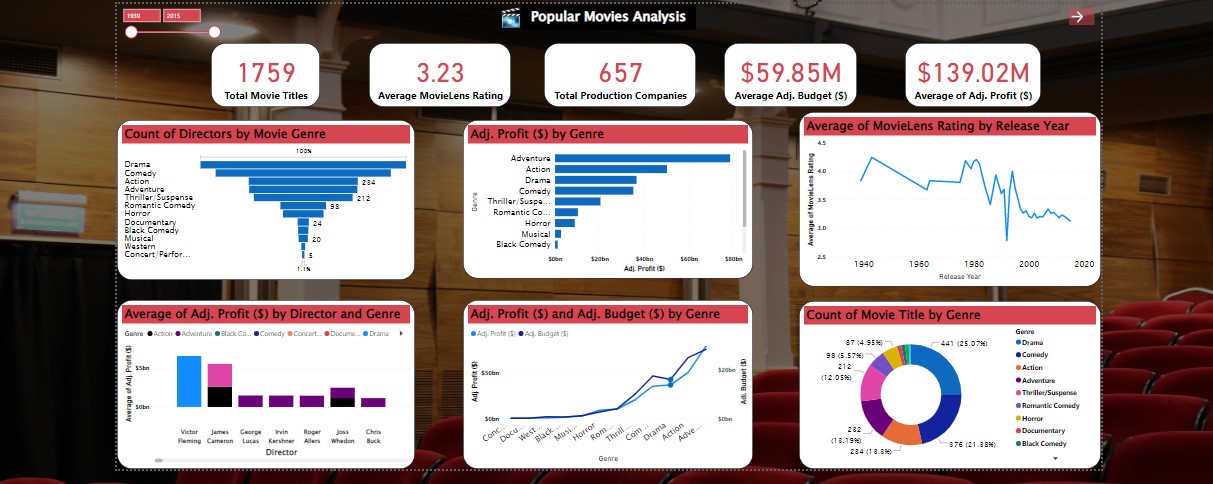
There were a total of 1,759 movies discovered. The average movie lens rating was 3.23 and 657 production companies were discovered in total.
The average adjusted budget for production was almost $60 Million ($59.85M), while the average adjusted profit from the movies produced was about $139 Million (139.02M)
The top 3 genres with the highest adjusted profits are Adventure, Action, and Drama.
The movies produced around 1943 had higher ratings (4.24) than movies around 1992(2.78)
The highest number of movies produced are mostly in the genre of Drama (25.07%) followed by Comedy (21.38%) and then Action (13.3%)
Most Directors also directed more movies following the same order
Movies that had the highest adjusted profit were mostly released on Fridays.
Victor Fleming was the director whose 1939 movie had the highest adjusted profit
I would easily advise John Smith that the average amount that he should expect to spend on making a really good movie is about $60 Million. I can further say that we know what type of director he should be looking to hire to direct his first Drama movie to maximize profits (Victor Fleming).
Also, John should consider diving into Drama and Adventure genre movies because these genres have the highest average adjusted profit throughout this time, even though they may require a substantially higher budget. Lastly, releasing his movie on a Friday or weekend will generally be a better idea than on a weekday!
As we can see, the questions asked at the beginning gave direction to the type of data to use, which in turn triggered our quest for discoveries and finally will enable us to recommend data-driven optimum decisions for John Smith of Star Media Inc.
Thank you for reading! I hope you enjoyed the walkthrough of this analysis as much as I enjoyed working on it.🤩
